
Dashboard Control Panel
The botmux dashboard command prints the current rotating login-token URL for unified control across all daemons / bots in the browser.
This is a rotating login token: a URL stays valid until
botmux dashboard rotatereplaces it and invalidates the old URL; the token is persisted and survives abotmux restart. The bare/current command reuses that token, creating the first one when absent. A successful?t=visit just writes the same token into a cookie — it does not consume or revoke it, so the same URL logs in repeatedly until rotation. Sharing the URL ≈ sharing the login state, so keep it safe. Default port7891, overridable viaBOTMUX_DASHBOARD_PORT.
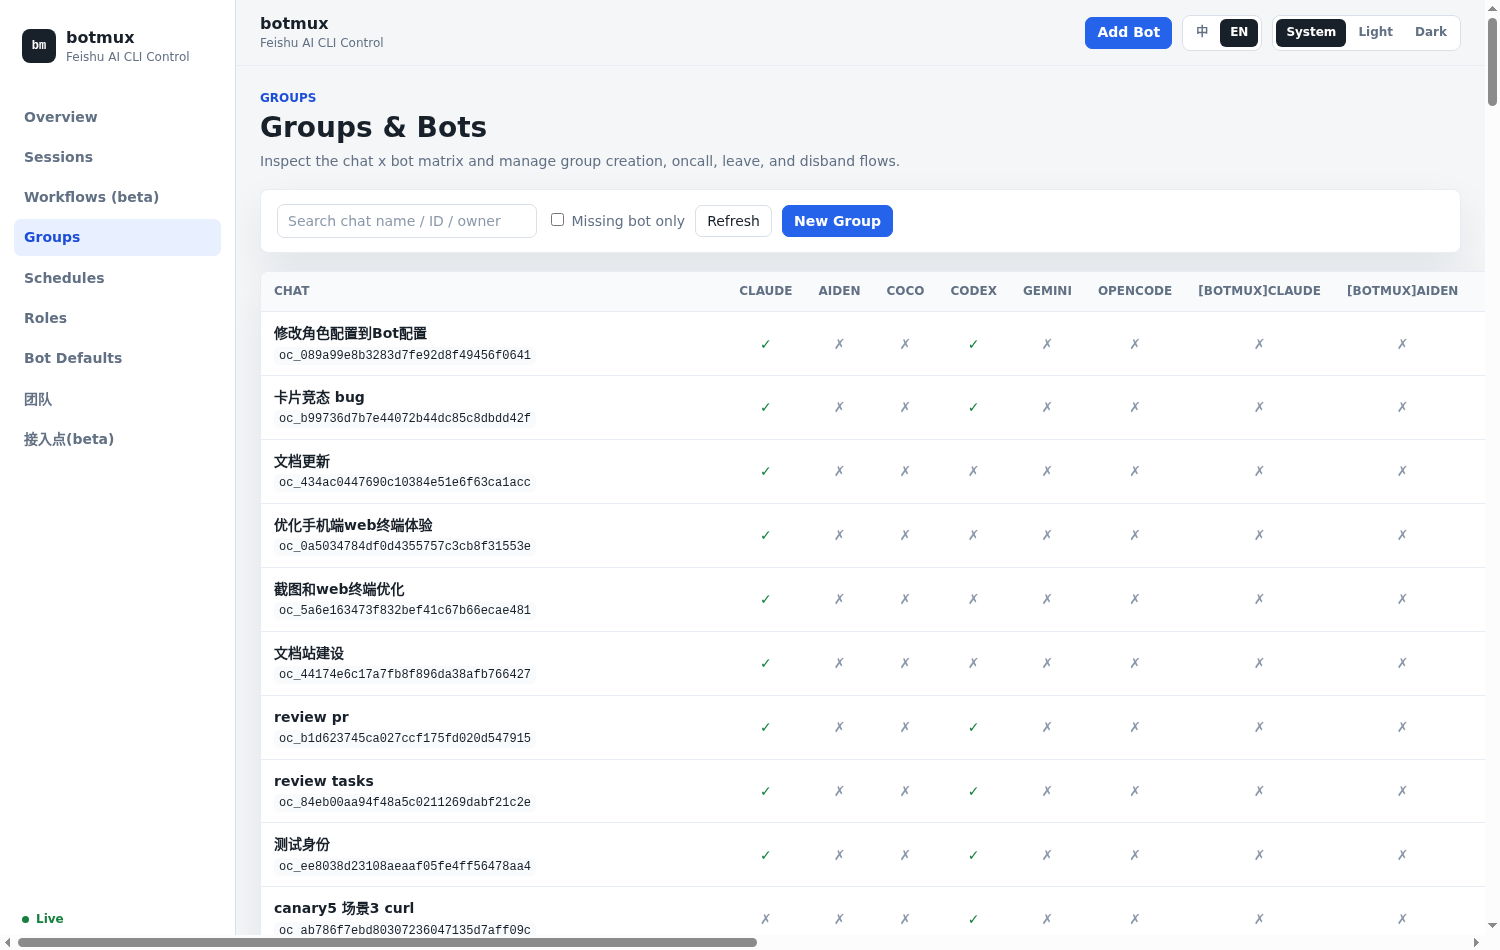
Groups panel: a chat × bot matrix that shows at a glance which bots are in which groups
Features
- Sessions: lists active + closed sessions across all bots, filterable by CLI / status / adopt / text. Open a detail view to copy various IDs, close sessions, and multi-select batch close; "locate topic" has the bot post an @-mention of the session owner in the original topic (a bare @, no other text) to help you jump back to the context. Chat-scope session rows also carry a Lark group AppLink straight to the chat.
- Schedules: creates, edits, and manages scheduled tasks, including Run now, Pause/Resume, multiple target chats, execution logs, and testable Bash preconditions.
- Groups: one-click create a new group (auto @-notifies the invited user), add bots to a group, and auto-transfer group ownership; disband groups and have bots leave groups (associated sessions are cleaned up automatically). The group Manage modal also handles authorization management: multi-select member batch grant (up to 50 at a time, live membership re-check before writing, optional message quota and duration), authorize the whole group in one click (the Dashboard equivalent of bare
/grant), block an individual member, and toggle on-call per bot. - Team / Roles / Bot Defaults: the Team panel handles cross-deployment collaboration (invite someone else's deployment into your team, create cross-deployment groups); Roles manages each bot's per-group persona; Bot Defaults (Bot configuration) sets default behaviors (new-group on-call, group mention policy, the
blockedUsersblock list, the quiet preset — a one-time write that turns off streaming cards / thinking bubbles and silences ✋✅ reactions, not a persistent binding, card signature, default role, etc.). - Workflows control panel: Run List polling; Run Detail shows the summary / dangling red zone / node-activity / event timeline / concurrent-execution timeline; you can cancel a run directly.
- Settings / System & Maintenance: authenticated administrators can manage Start the botmux background service at boot.
Two things live outside the Dashboard: a v3 workflow's humanGate approve / reject happens on a Lark approval card (not clicked in the Dashboard); triggering a workflow with parameters currently goes through the connector (Webhook) path (see Connectors) — there is no "Workflow Catalog + parameterized trigger" page in the Dashboard. The Dashboard's Workflows panel focuses on observation and cancel.
Background-Service Auto-Start
Authenticated administrators can manage botmux background-service auto-start under Settings → System & Maintenance. Anonymous users cannot view or change this setting.
The toggle reuses the existing botmux autostart behavior. It only manages the entry used at the next boot/login and does not start, stop, or restart the current daemon.
Authenticated integration actions
An authenticated host integration can rename a Lark group through one explicit bot identity:
Both path segments must be URL-encoded. The selected bot must currently be in
the group; botmux never falls back to another configured bot. The name follows
Lark's 100-code-point limit and rejects control or invisible formatting
characters. The request body is limited to 4 KiB and accepts only name.
Authentication uses the existing Dashboard management boundary described
below; publicReadOnly never makes this mutation anonymous.
External read-only queries
The primary external observation surfaces documented here are:
GET /api/dashboard/v1/summary: a versioned, strongly redacted fleet summary.GET /api/sessions: the current aggregate of active + closed session rows.GET /events: the Dashboard's external SSE stream. For session events,session.spawnedcarries the full values inbody.session, whilesession.updatecarries changes inbody.patch. Each daemon also has a loopback-only/api/eventsendpoint for Dashboard aggregator IPC; it is not the external URL.
Dashboard Summary API
GET /api/dashboard/v1/summary lets an external status page, monitor, or orchestrator treat a regular botmux fleet as a long-running daemon service. It reads live sessions and schedules from the currently online daemons, then returns only positively allow-listed status and counts. It never returns bot or session IDs, titles, group names, working directories, prompts, schedule contents, or diagnostic logs. Its 200, 429, and 503 responses include Cache-Control: no-store.
This is a Dashboard facade for regular fleet mode, served by the
botmux-dashboardprocess started alongsidebotmux start.botmux serve --api-onlyis a core-only, single-process mode that does not start the Dashboard, so this route does not exist there. See Core-only API Control for that mode's health and control endpoints.
A successfully generated snapshot returns HTTP 200. A 200 means that snapshot generation succeeded; service.status is still degraded when a configured bot is offline:
If any live daemon's sessions or schedules snapshot times out, fails, or has a malformed shape, the endpoint returns HTTP 503. Count fields are deliberately omitted rather than presenting missing state as zero:
Anonymous requests are subject to a rolling, Dashboard-process-global limit shared by every anonymous caller: at most 5 requests in any 10-second window. The sixth request returns HTTP 429:
The Retry-After response header carries the same decimal number of seconds (at least 1, normally 1–10); wait that long before retrying. Requests authenticated with the current Dashboard token are exempt from the anonymous limit. Authentication uses the existing Dashboard login state: a valid ?t=<token> first returns a 302, sets the botmux_dashboard_token cookie, and redirects to the URL without the query. A pure API client that needs the exemption must retain and return that cookie. Authorization: Bearer is not accepted here.
Session row optional fields
The following fields belong only to the richer /api/sessions rows and /events session payloads; they are never returned by the summary endpoint. They are all optional, so consumers must handle older sessions/daemons that omit them:
publicReadOnly and the token boundary
publicReadOnly is on by default. While it is enabled, allow-listed reads including GET /api/dashboard/v1/summary, GET /api/sessions, and GET /events are reachable without a token on the Dashboard listener. The summary contains only the strongly redacted aggregate above; session names, titles, backends, and the other session/event row metadata must be treated as public to that network.
- Every POST / PUT / PATCH / DELETE mutation, every GET outside the read-only allow-list, and every raw PTY / diagnostic log still requires the current token issued by
botmux dashboard. The allow-list is fail-closed: a newly added GET endpoint does not become public merely because public read-only mode is enabled. - When
publicReadOnlyis off, a tokenless summary request returns 401. A request carrying the current token remains available and is exempt from the anonymous rate limit. In public read-only mode, an incorrect or rotated old token is treated as anonymous. botmux dashboardandbotmux dashboard currentreuse the current token (creating the first one when absent);botmux dashboard rotateexplicitly replaces it and invalidates the previous link. The token is application-layer Dashboard access, not a replacement for host firewall, VPN, or reverse-proxy authentication.- If tokenless observation is unnecessary, turn off Public read-only under Dashboard Settings. You can also start with
BOTMUX_DASHBOARD_PUBLIC_READONLY=false; once the setting has been saved in the UI, the persisted value in~/.botmux/config.jsontakes precedence over the environment variable.
Deployment details
The dashboard runs as a separate pm2 process botmux-dashboard, starting and stopping together with the daemon. Each daemon exposes an internal IPC on 127.0.0.1 (local only), and the dashboard process acts as a reverse proxy + HMAC auth: the secret file ~/.botmux/.dashboard-secret (mode 0600) is the internal daemon↔dashboard signing key and is never sent down to the browser (the browser side uses the rotating login token above).